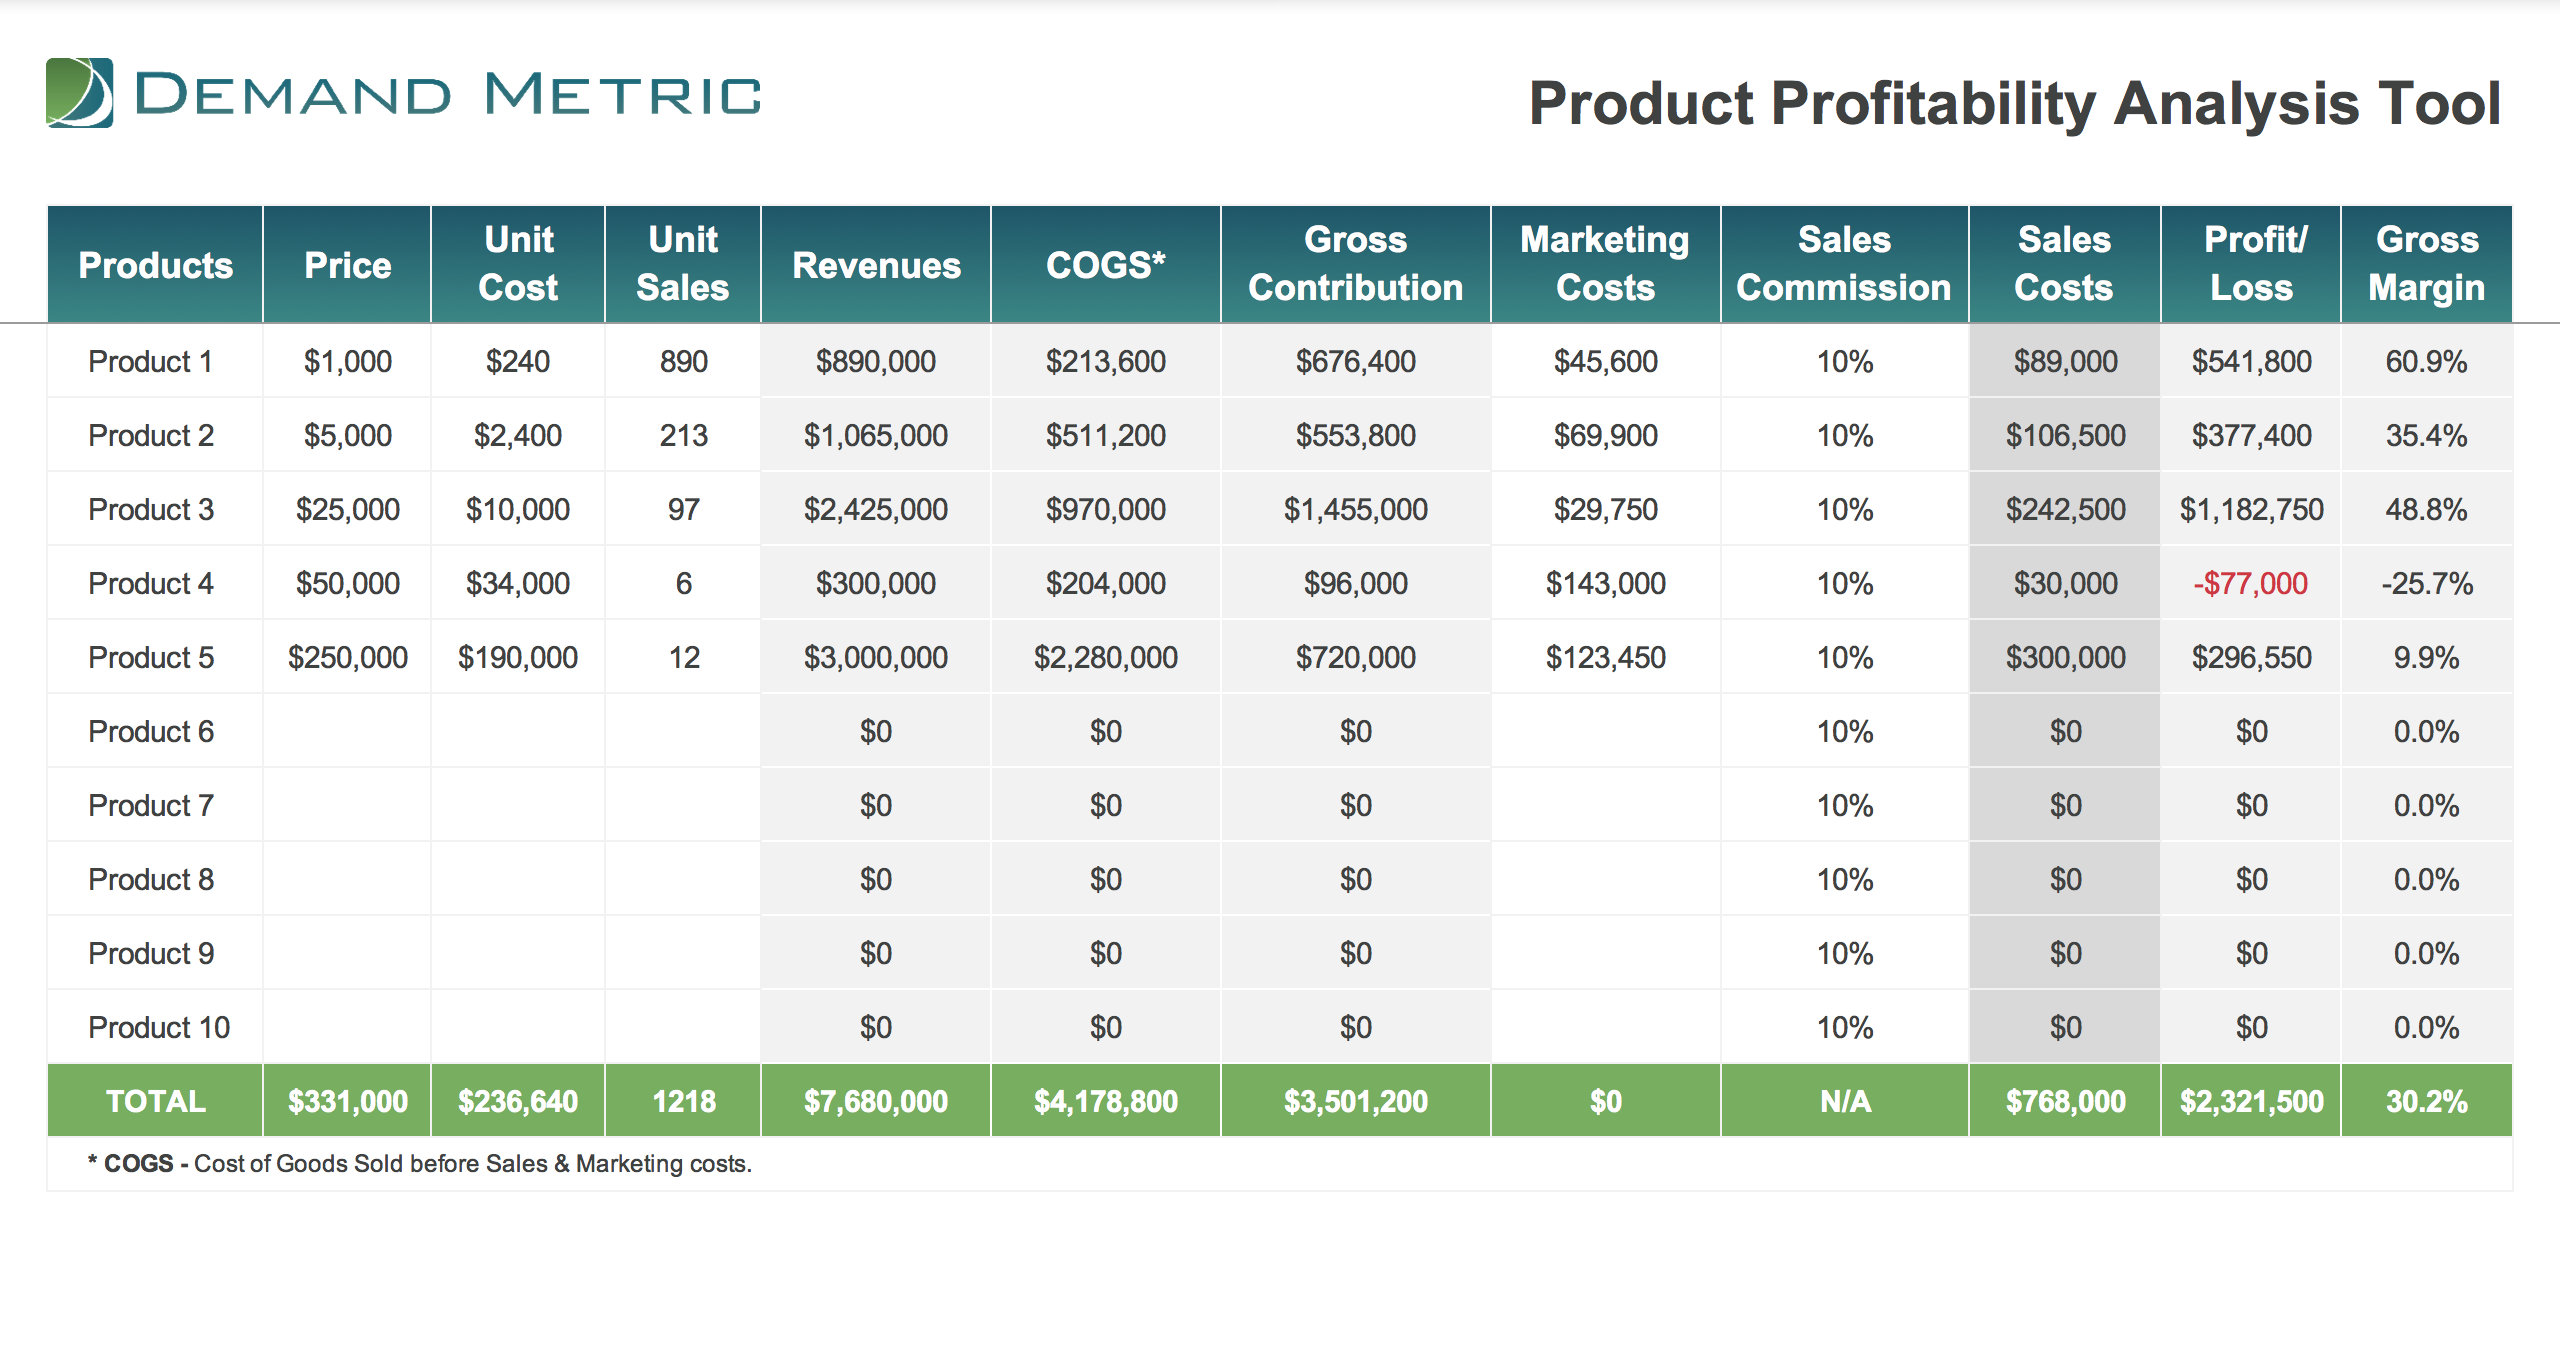
A calculator to input cost & sales variables and determines break even point and profitability.
You are in the process of examining a product/product line and you aren't sure how many units you need to sell to hit the break-even point. It is important that you determine the unit contribution and variable cost per unit.
We created a Break Even analysis calculator help you determine break-even point and profitability. To use this resource, enter the break-even analysis tab and input your sales data, variable costs and fixed costs. As you enter this data, you will see two pie charts, one a unit contribution margin and the other a variable cost per unit chart. At the bottom a net profit/loss number will be automatically presented.
After you have entered all of your data, visit the results tab, where you will be able to see your profitability in terms of sales volume. In the profitability chart you will see the interception of the fixed cost, variable cost and total sales. This is an excellent exercise to go through if you are trying to determine if it wil be profitable to sell a particular product.
Download our free Product Development Strategy Methodology to see how this tool functions as part of a product development process.
A calculator to input cost & sales variables and determines break even point and profitability.